Ultimate Guide to Custom Mood Tracking Metrics
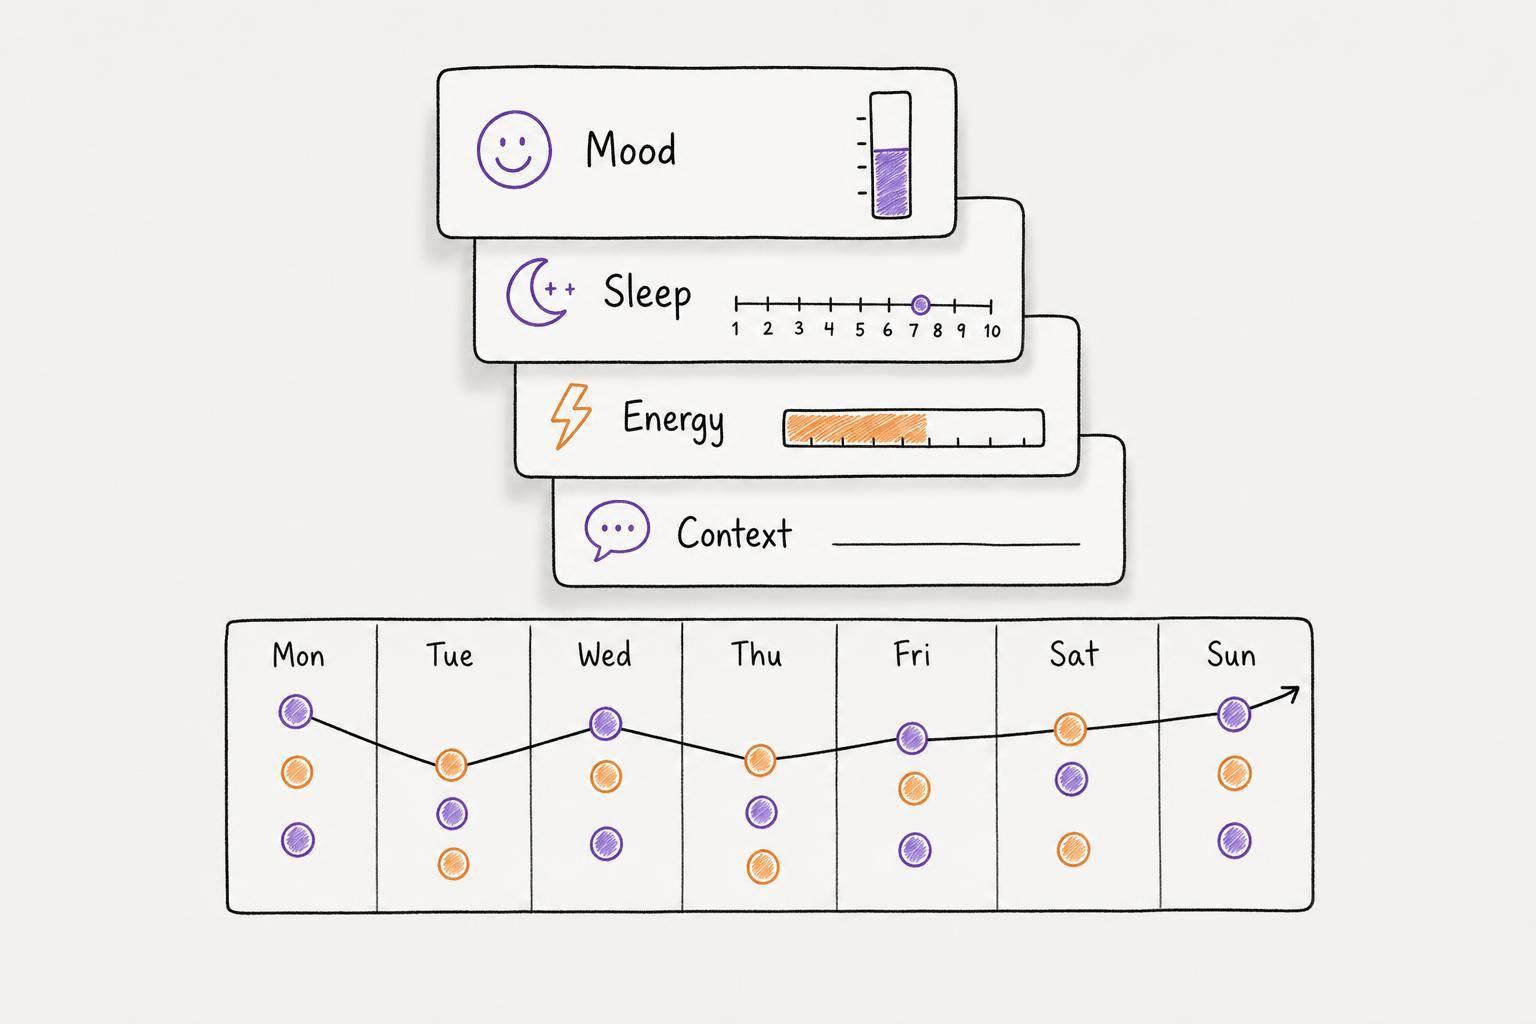
One mood score is often too vague to help. I get better data when I track a few separate signals - like mood, energy, focus, stress, and stability - instead of forcing my whole day into one number.
Here’s the short version:
- I keep my system small
- I track mood + intensity, not just “good” or “bad”
- I separate energy from mood
- I add sleep, focus, and context when they explain bad days
- I use 3 short check-ins: morning, midday, and evening
- I review my notes once a week for patterns, drains, and supports
The article’s core idea is simple: if I log the right few signals in seconds, I can spot links a basic mood log misses. That includes things like low sleep, back-to-back meetings, social overload, or ADHD task management and task initiation trouble.
A few facts stand out:
- Under 6 hours of sleep is linked with more irritability and anxiety the next day
- Weekly review only needs 15–20 minutes
- Patterns often get easier to see by week 4
- A 1–5 or 1–10 scale works best when each number has a fixed meaning
If I want a simple starting point, this is enough:
- Mood label + intensity
- Sleep hours + sleep quality
- Energy level
Then, if I need more detail, I add:
- Focus
- Stress
- Physical symptoms
- Daily context tags
This approach works well because it helps me name what I feel with more precision, see what affects my day, and keep tracking light enough to continue.
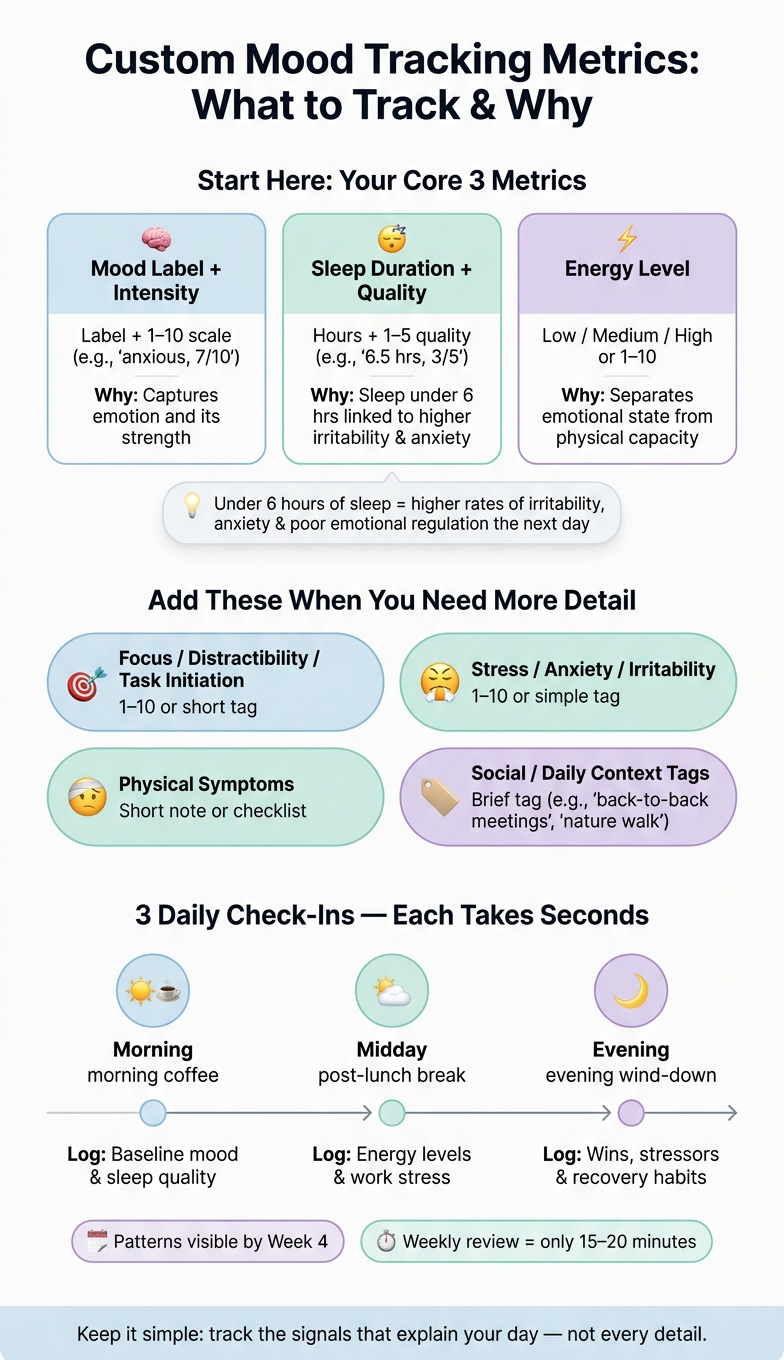
Custom Mood Tracking Metrics: What to Track & Why
The Best Mood Tracker - How We Feel
sbb-itb-1b3be24
Choose the Right Mood Metrics to Track
Track the few signals that explain your day. You do not need to log every possible detail. In fact, that usually backfires.
The best metrics are the ones you can record in seconds and stick with day after day. A simple place to start is mood, intensity, and energy.
Mood, Intensity, and Emotional Tone
Mood gets more useful when you split it into two parts: the emotion itself and how strong it feels. The label tells you what you’re feeling. The rating tells you how much. Put together, they say far more than either one on its own.
Simple scales like 1–5 or 1–10 work well, especially if you give them clear anchors. A format like label + number keeps things fast and easy to read later, such as "content, 4/10" or "overwhelmed, 8/10."
It also helps to think in terms of valence and arousal. Those are two different axes: pleasant vs. unpleasant, and calm vs. activated. That matters because feelings don’t always line up neatly. You can feel calm and deeply sad. You can also feel anxious and oddly energized. If you track both, even in a loose way, you’ll catch mixed states that one single mood score would miss.
From there, it helps to separate energy, focus, and stress so you can see the difference between mood and day-to-day functioning.
Energy, Focus, Stress, and ADHD-Specific Signals
Energy deserves its own line because mood and energy often move in different directions. You might feel emotionally fine and still be physically drained. Or you might feel low but have enough energy to get through the day. A simple energy tag - like low, medium, or high - can show whether a hard day came from mood, fatigue, or both.
If you’re tracking ADHD-related patterns, a few functional signals tend to be the most helpful:
- Focus quality
- Distractibility
- Task initiation difficulty
- Irritability
- Stress level
These signals help you spot when executive function, not mood alone, is driving the day.
Sleep, Physical State, and Daily Context
Sleep is one of the biggest drivers of next-day mood. Sleeping fewer than six hours is tied to much higher rates of irritability, anxiety, and poor emotional regulation the next day. A quick log like "6.5 hours, 4/10" gives you both the number of hours and how rested you felt, which aren’t always the same thing.
Physical signs matter too. Headaches, muscle tension, or appetite changes often show up before a mood shift is easy to name. These tags are there to explain why your mood changed, not to build a giant health diary.
The same goes for social load. It’s not just whether you were around people. It’s whether those interactions left you feeling charged up or worn down. You can also tag things like exercise, caffeine, alcohol, screen time, or a heavy work block if those seem to affect your day.
A lean starter set looks like this:
| Metric | Suggested Format | Why It Matters |
|---|---|---|
| Mood label + intensity | 1–10 with label (e.g., "anxious, 7/10") | Captures the emotion and its intensity |
| Sleep duration + quality | Hours + 1–5 quality (e.g., "6.5 hrs, 3/5") | Shows sleep's impact on next-day mood |
| Energy / fatigue | Low / medium / high or 1–10 | Separates emotional state from physical capacity |
| Focus / distractibility / task initiation | 1–10 or short tag | Flags executive function changes that affect mood |
| Stress / anxiety / irritability | 1–10 or simple tag | Flags strain before mood drops further |
| Physical symptoms | Short note or checklist | Early warning signs of overload |
| Social / daily context | Brief tag or note | Shows which situations shift mood day to day |
Start small: mood, sleep, and energy. If that gives you enough signal, stick with it. If not, add focus and context tags as needed.
Next, turn these metrics into a simple daily workflow.
Design an ADHD-Friendly Tracking System
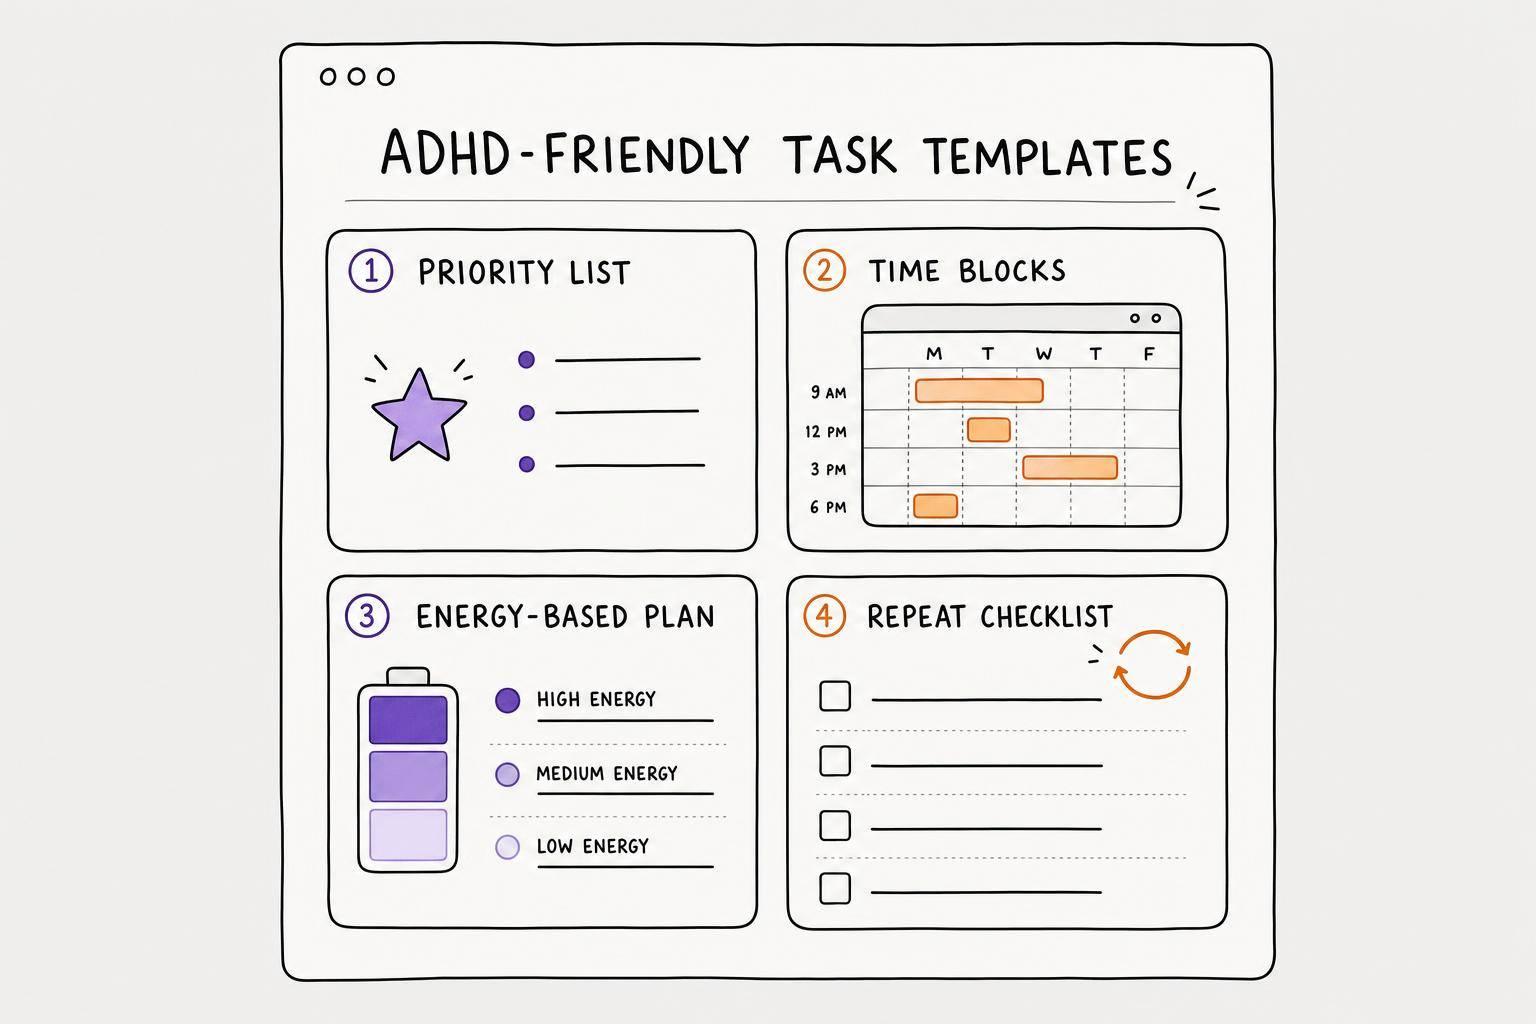
Build a system you can log in seconds, perhaps by using an ADHD productivity planner app. If tracking starts to feel heavy, consistency usually falls off fast. Once you’ve picked your core metrics, make them easy to log and easy to review.
Start with Goals and a Small Daily Metric Set
Before you pick any metrics, ask yourself one thing: what do you want to learn? If you want to understand why some days feel impossible, track mood, energy, and focus. If you want to see how sleep affects your mood, add sleep quality. The goal should shape the system, not the other way around.
Start small. Three fields are enough at first. Add more only after the habit feels steady.
Use Simple Scales, Concrete Labels, and Consistent Tags
Use anchored scales and short labels. Give each number a fixed meaning, like "1 = drained" and "10 = energized." That makes each check-in faster and more clear. For mood, word labels such as Calm, Anxious, Irritable, Content, or Overwhelmed give you more detail than a number by itself.
For context tags, keep your wording the same every time. Pick one label and stick with it. Tags like "late coffee", "nature walk", or "back-to-back meetings" work well because they’re short, specific, and easy to scan during a weekly review.
Review and Adjust the System Over Time
Your first version is a draft, so drop what you don’t use.
Review the system each week. Keep fields you use, remove fields you skip, and combine fields that tell you the same thing. A monthly audit is a good time to clear out unused fields and check that each data point is producing insight.
If you miss a few days, don’t backfill from memory. Just start again at the next check-in.
Next, plan your day to fold these metrics into a daily routine so the habit happens with less effort.
Put the Metrics into Your Daily Workflow
Once you've picked the few metrics that matter, build them into your day. The goal is consistency, not perfect data. Keep each check-in short so it never starts to feel like a chore.
Set Short Check-Ins and Pair Them with Existing Routines
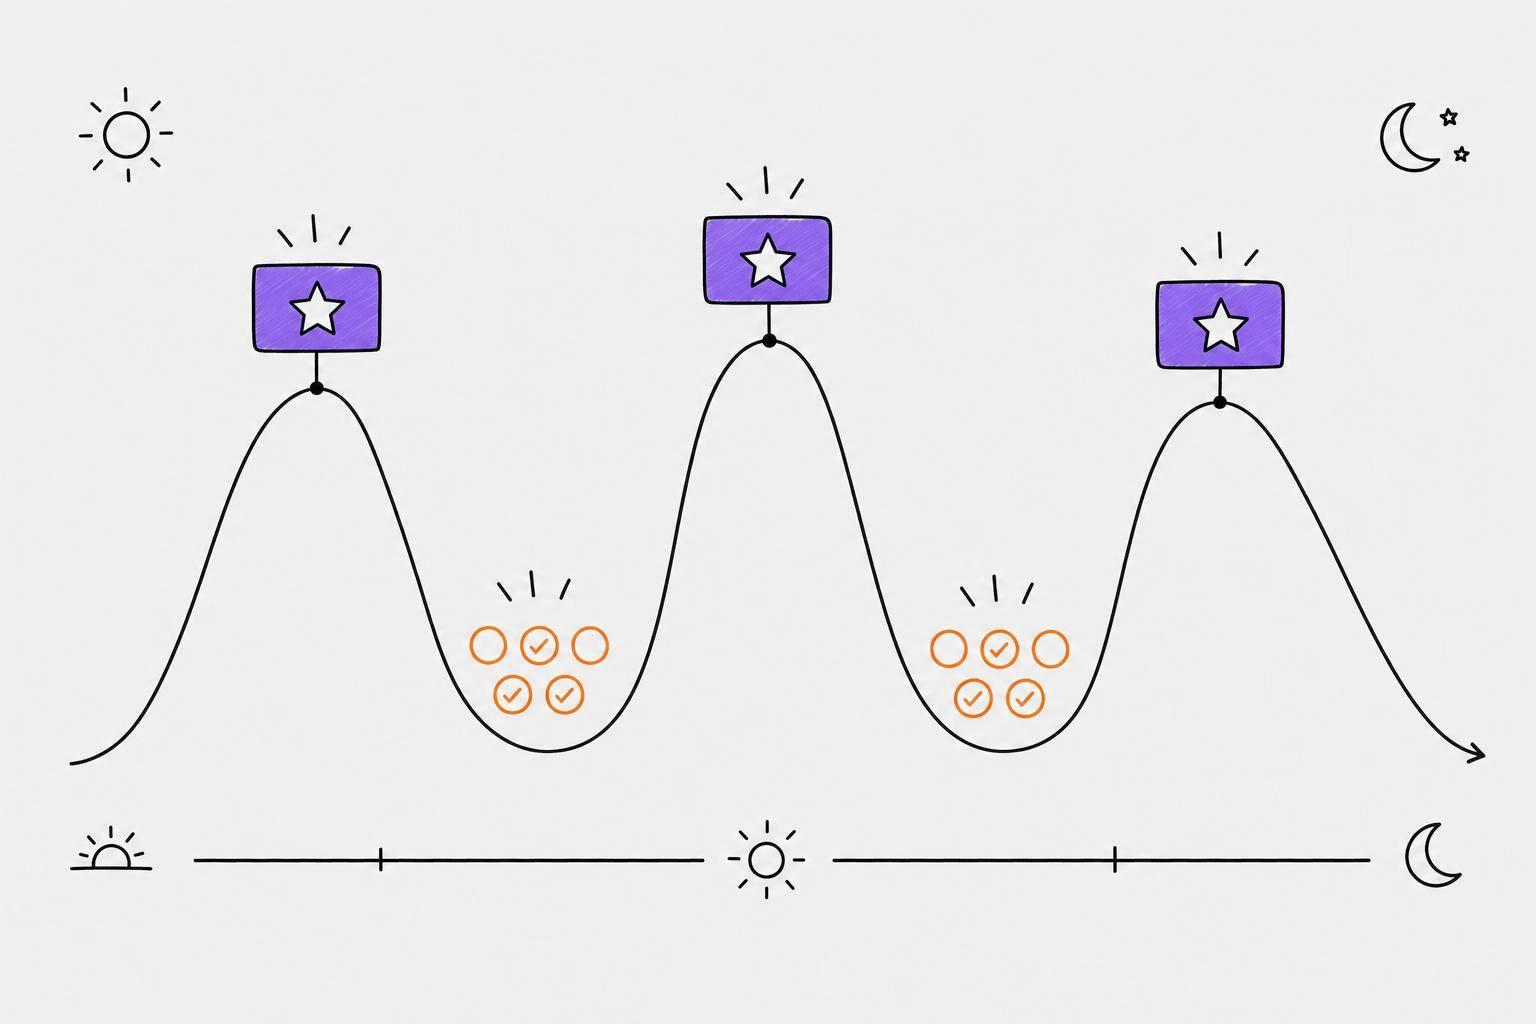
Three check-ins a day is a solid rhythm: morning, midday, and evening. The easiest way to make that stick is to attach each one to something you already do. Log your morning mood while your coffee brews. Do your midday check-in right after lunch. Add your evening entry as you wind down for bed. When tracking is tied to an old habit, it tends to happen without much push.
| Check-In | Routine Anchor | What to Log |
|---|---|---|
| Morning | Morning coffee | Baseline mood & sleep quality |
| Midday | Post-lunch break | Energy levels & work stress |
| Evening | Evening wind-down | Wins, stressors, and recovery habits |
Use Voice Journaling and Short Prompts
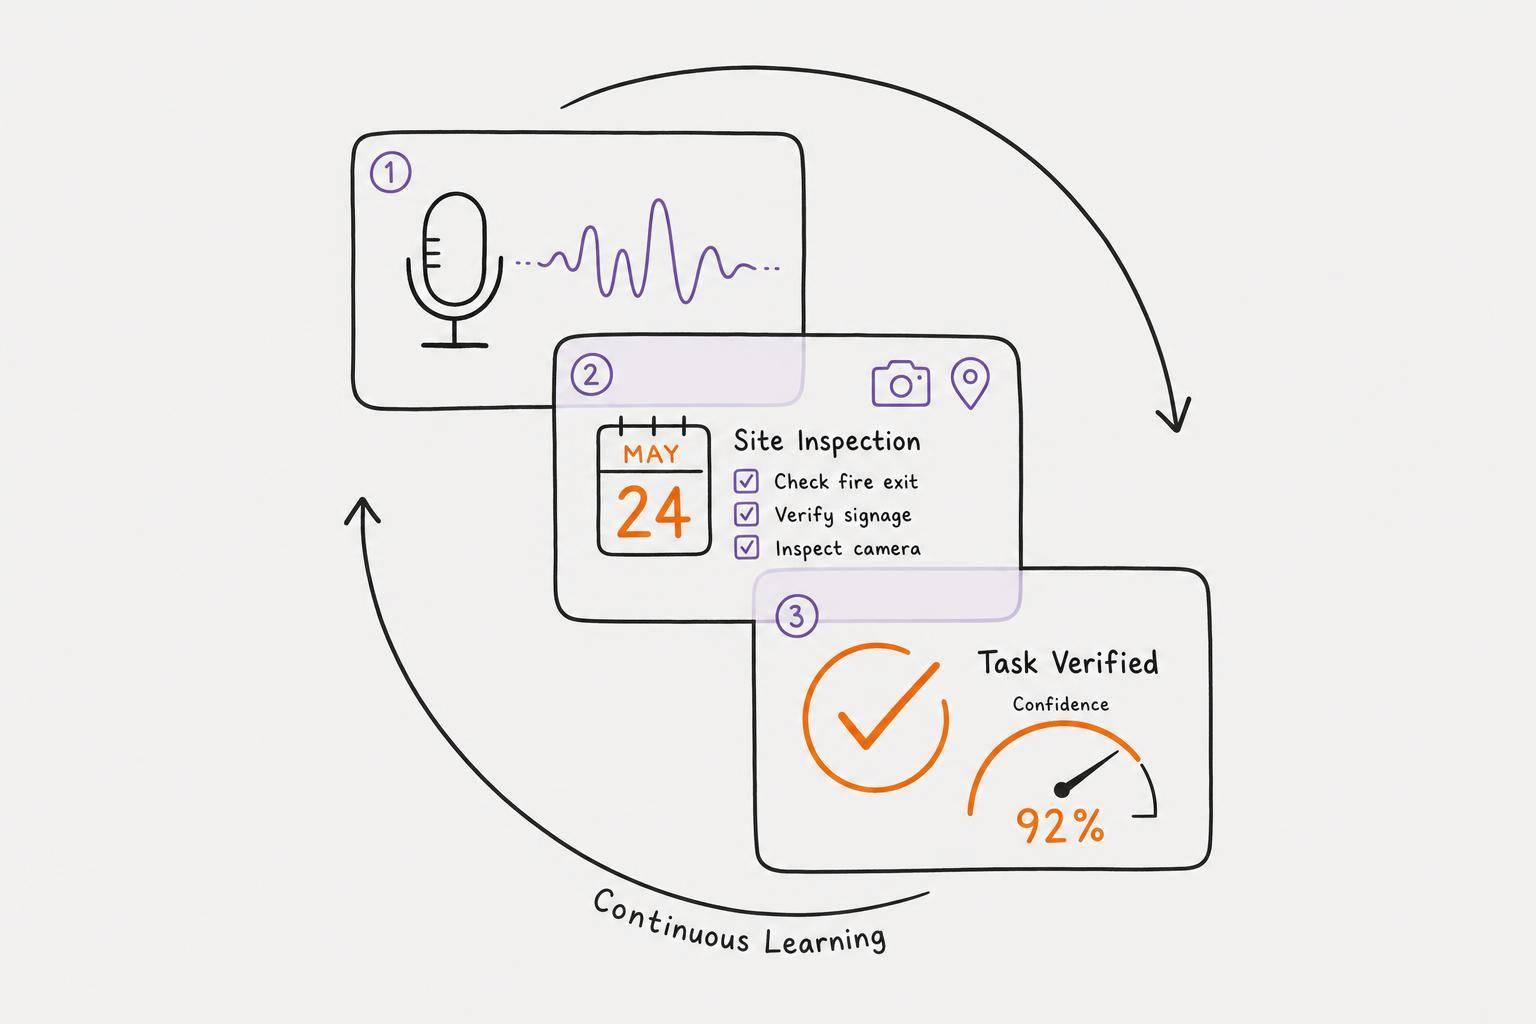
Typing a mood entry in the middle of the day is easy to put off. Speaking it out loud takes a few seconds. Voice notes also catch the feeling closer to the moment it happened. A quick note like "scattered, energy 4/10" can hold mood, context, and intensity all at once. That rough thought can then be turned into a clean, tagged log entry without extra work from you.
Naming what you feel isn't just useful for tracking - it actively helps regulate the emotion itself.
Track Mood with Calma's Low-Friction Tools
This is where Calma comes in. Its voice-to-text journaling lets you speak a raw thought and have it turned into a structured log entry with detected emotions, tags, and context. Calma turns voice entries into structured mood logs and visual trends, which makes patterns easier to spot.
If manual logging feels like too much, this setup removes the biggest hurdle: the effort it takes to log in the first place.
Once logging becomes automatic, those entries start to show patterns you can actually use.
Analyze Patterns and Keep the Practice Going
Once your check-ins feel steady, start looking for patterns. Set aside 15–20 minutes once a week to review your entries. Sunday evening works well for a lot of people. You're not doing a deep analysis here. You're just scanning for links.
Ask a few plain questions:
- Does your mood dip after back-to-back meetings?
- Does focus get better on days you slept 7+ hours?
- Do certain workdays leave you more drained than others?
After a bit of time, two groups usually start to stand out.
Levers are the things that tend to lift your mood or energy. That could be morning sunlight, exercise, or a high-protein meal. Drains are the things that often show up before a dip. Think back-to-back meetings, social overload, or high stress.
Once you can name both, you can do something with them. Write one page with your main triggers, your best supports, and two low-energy reset steps. Early on, the data can feel messy. By week four, repeat patterns are often much easier to spot.
It also helps to turn those notes into something you can scan fast. Charts and tables make this easier. A simple line chart of your daily mood score across 30 days can show baseline shifts that single entries may miss. Calma's visual habit progress grids work the same way. You can see which days your habits held and which ones slipped, without digging through every note.
When you review your data, look at entries in pairs. Sleep + focus. Workload + irritability. That matters because stacked effects are easy to miss when you read each entry on its own.
The table below gives you a quick way to read what your numbers may be saying:
| Mood Level | Sleep Hours | Energy Level | Focus |
|---|---|---|---|
| High (8–10) | 7.5+ hours | High / Alert | Sharp, flow state |
| Neutral (5–7) | 6–7 hours | Moderate / Steady | Functional |
| Low (1–4) | Under 6 hours | Drained or Wired | Distracted, foggy |
Conclusion: Keep the System Simple, Useful, and Flexible
Keep the system light. If a field stops helping, cut it. If you miss a few days, start again. Missed days don't break the system. The best setup is the one you'll keep using.
"Mood tracking should feel like checking a gauge, not taking a test." - Mindspace Team
FAQs
How do I choose the best mood metrics for me?
Start simple and keep it sustainable. Use a steady 1-to-10 or 1-to-5 scale, and track only three to five factors that fit your goals, like sleep quality, energy, stress, social contact, or daily habits.
It also helps to track how well you function, not just how you feel. The best metrics are the ones you can stick with day after day, so if tracking starts to feel like a chore, cut back on the number of fields.
What if I forget to track for a few days?
Missing a few days is normal. It doesn’t mean you’ve failed.
The best move is simple: start again the next day. Don’t try to fill in the blanks from memory, because memory can be off.
Even patchy data can still help. And if staying consistent feels tough, Calma can make tracking easier with quick emotion tracking and a low-cognitive-load design.
How long does it take to notice useful patterns?
Most people start to spot basic patterns - like day-to-day changes or weekly cycles - after 2–4 weeks of steady daily tracking.
The deeper stuff usually takes longer. Monthly cycles, seasonal changes, or less obvious triggers often show up after 2–3 months of data.
The big thing is consistency. The more regularly you track, the easier it gets to see what’s going on. Tools like Calma can help make daily tracking simpler.